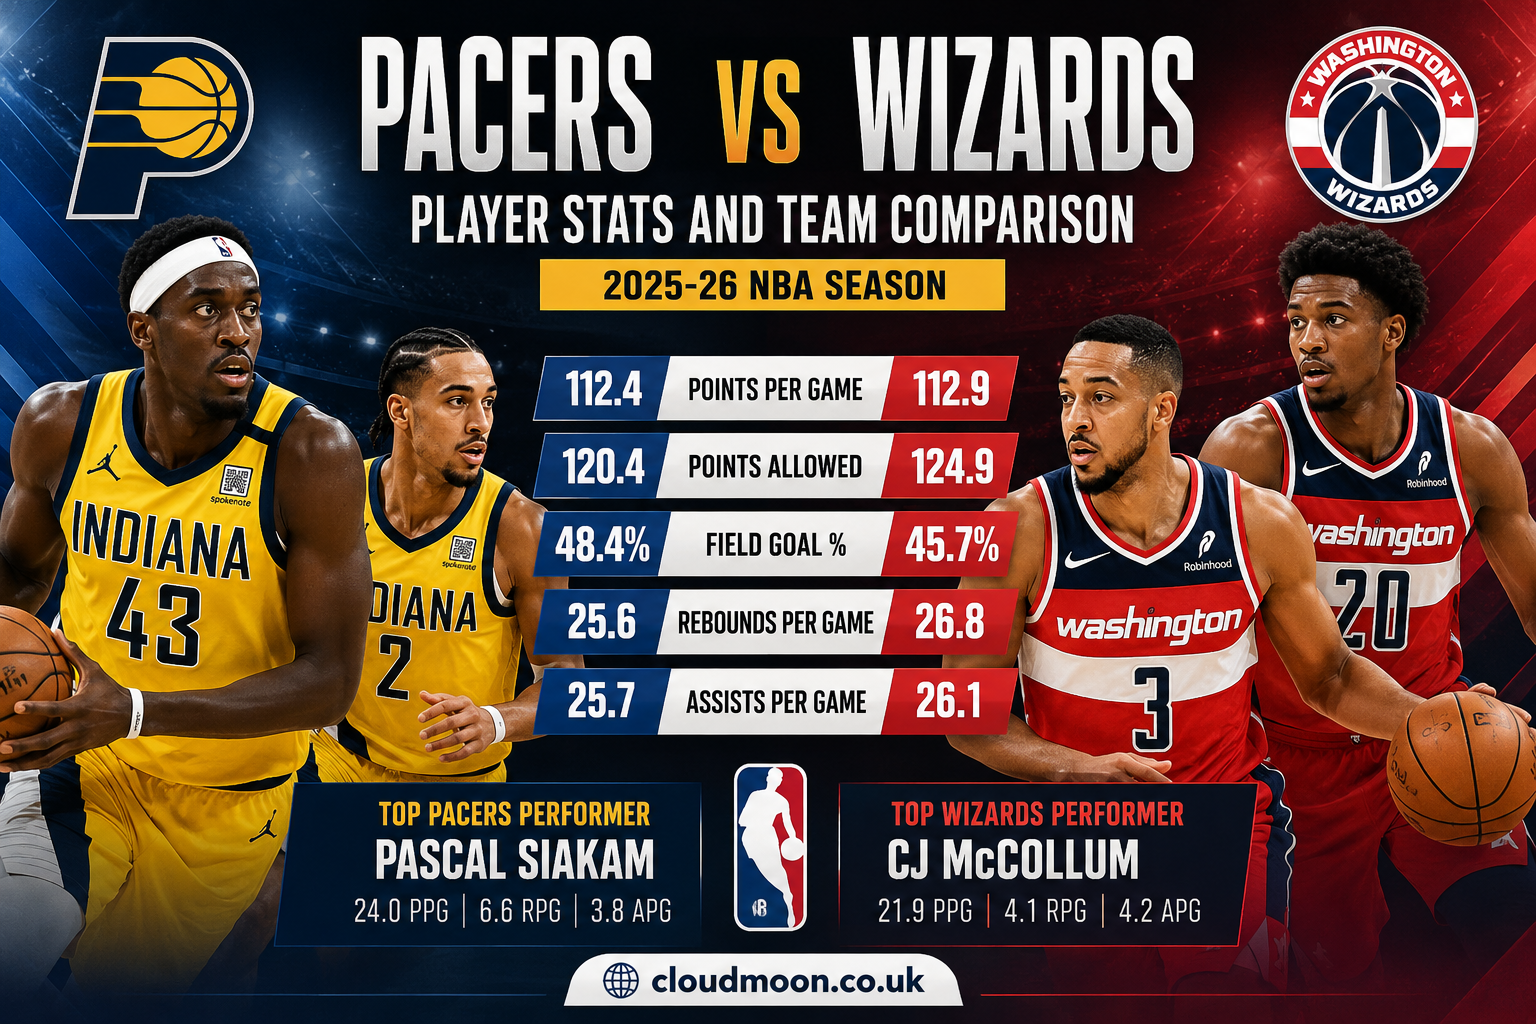
The Pacers vs Wizards matchup offers an interesting comparison between two Eastern Conference teams with very different 2025-26 season profiles. Indiana finished the regular season 19-63, while Washington finished 17-65. Both teams struggled overall, but their individual player performances provide plenty of useful context when evaluating this matchup.
Indiana and Washington also met four times during the 2025-26 regular season. The Pacers won the first meeting, but the Wizards took the next three, making the season series a particularly useful reference point when comparing the teams.
Pacers vs Wizards: 2025-26 Team Comparison
The simplest way to understand this matchup is to start with the overall team numbers.
| Category | Indiana Pacers | Washington Wizards |
|---|---|---|
| Regular-season record | 19-63 | 17-65 |
| Eastern Conference finish | 14th | 15th |
| Points per game | 112.4 | 112.9 |
| Opponent points per game | 120.4 | 124.9 |
| Offensive rating | 110.9 | 111.0 |
| Defensive rating | 118.8 | 122.7 |
| Net rating | -7.9 | -11.8 |
| Pace | 101.0 | 101.4 |
Indiana scored 112.4 points per game, slightly below Washington’s 112.9. The bigger difference came defensively: the Pacers allowed 120.4 points per game compared with 124.9 for Washington. Indiana also had the better defensive rating and net rating.
That distinction matters because raw scoring alone does not tell the entire story. Both teams had offensive limitations, but Washington gave up points at a higher rate.
Pacers Player Stats
Pascal Siakam was Indiana’s leading scorer among its regular-season players, averaging 24.0 points, 6.6 rebounds and 3.8 assists across 62 games. He also shot 48.4% from the field and 35.8% from three-point range.
Bennedict Mathurin averaged 17.8 points per game in 28 appearances, while Andrew Nembhard contributed 16.9 points and 7.7 assists per game across 57 games. Nembhard’s playmaking was particularly important because assists help explain how Indiana generated offense beyond individual scoring.
Key Indiana statistical performers
| Player | PPG | RPG | APG | FG% | 3P% |
|---|---|---|---|---|---|
| Pascal Siakam | 24.0 | 6.6 | 3.8 | 48.4% | 35.8% |
| Bennedict Mathurin | 17.8 | 5.4 | 2.3 | 43.3% | 37.2% |
| Andrew Nembhard | 16.9 | 2.8 | 7.7 | 44.2% | 36.1% |
| Aaron Nesmith | 13.8 | 4.2 | 1.9 | 41.4% | 37.9% |
The table highlights an important feature of Indiana’s statistical profile: Siakam provided the primary scoring punch, while Nembhard supplied significant playmaking.
Aaron Nesmith also provided floor spacing, shooting 37.9% from three across his season workload.
Wizards Player Stats
Washington’s 2025-26 statistical picture was led by several different types of contributors.
CJ McCollum averaged 21.9 points per game in 35 games with Washington, along with 4.1 rebounds and 4.2 assists. Alex Sarr averaged 16.3 points, 7.4 rebounds and 2.7 assists, while also recording 2.0 blocks per game.
Kyshawn George posted 18.4 points and 5.5 assists per game in the relevant statistical sample, while Justin Champagnie averaged 15.6 points and 10.0 rebounds in his 69-game workload. Tre Johnson added 12.2 points per game.
Key Washington statistical performers
| Player | PPG | RPG | APG | FG% | 3P% |
|---|---|---|---|---|---|
| CJ McCollum | 21.9 | 4.1 | 4.2 | 45.4% | 39.3% |
| Kyshawn George | 18.4 | 6.3 | 5.5 | 43.8% | 38.1% |
| Alex Sarr | 16.3 | 7.4 | 2.7 | 48.2% | 33.3% |
| Justin Champagnie | 15.6 | 10.0 | 2.2 | 50.2% | 31.9% |
| Tre Johnson | 12.2 | 2.8 | 2.0 | 41.9% | 35.8% |
One of the most notable numbers belongs to Champagnie. His 10.0 rebounds per game gave Washington an important interior contribution, while Sarr combined scoring, rebounding and rim protection.
Pacers vs Wizards Head-to-Head Results
The teams played four times during the 2025-26 regular season.
| Date | Result |
|---|---|
| Nov. 28, 2025 | Pacers 119, Wizards 86 |
| Dec. 14, 2025 | Wizards 108, Pacers 89 |
| Feb. 19, 2026 | Wizards 112, Pacers 105 |
| Feb. 20, 2026 | Wizards 131, Pacers 118 |
Washington finished the season series with a 3-1 advantage. Indiana’s only win came in the first meeting, when it produced a 33-point victory. The Wizards then responded by winning the next three games.
The final two meetings were particularly significant because Washington scored 112 and 131 points, Pacers vs Wizards respectively, against Indiana.
What the Head-to-Head Stats Tell Us
The season series shows why individual player statistics need to be viewed alongside team performance.
Indiana had the better overall defensive rating for the season, but Washington still found ways to win three meetings. This suggests that matchup-specific performance can differ substantially from season-long averages.
The first meeting was a strong example. Indiana won 119-86, with Siakam scoring 24 points and grabbing 11 rebounds. Bennedict Mathurin added 20 points, while Sarr led Washington with 24 points and nine rebounds.
By contrast, Washington won the February 20 meeting 131-118, showing how quickly the matchup could shift when the Wizards’ offense was productive.
Scoring Comparison
Scoring efficiency is more informative than simply comparing points per game.
Siakam’s 48.4% field-goal percentage gave Indiana a reliable high-volume scoring option. Mathurin also shot 37.2% from three, providing useful perimeter production.
For Washington, McCollum’s 39.3% three-point shooting gave the Wizards an experienced perimeter scorer. Sarr’s 48.2% field-goal percentage was also notable for a young frontcourt player.
The difference is largely about offensive roles. Indiana leaned heavily on Siakam’s scoring and Nembhard’s creation, while Washington had a broader mixture of perimeter scoring and developing frontcourt production.
Rebounding Comparison
Rebounding was another important area in the matchup.
Sarr averaged 7.4 rebounds per game, while Champagnie recorded 10.0. For Indiana, Siakam led the primary listed players with 6.6 rebounds per game.
Washington’s stronger individual rebounding numbers suggest that controlling the defensive glass can be an important factor in future Pacers-Wizards meetings.
Extra possessions matter in closely contested games. Offensive rebounds can create second-chance opportunities, while defensive rebounds help end opposing possessions.
Playmaking and Ball Movement
Andrew Nembhard’s 7.7 assists per game stand out in the Pacers’ statistical profile. He was not simply a scorer; he was also an important creator for teammates.
Washington had several players contributing to ball movement. Kyshawn George averaged 5.5 assists per game, while McCollum added 4.2.
That creates an interesting contrast:
- Indiana: Nembhard was a major assist contributor alongside Siakam’s scoring.
- Washington: Playmaking was distributed among several players.
- Key matchup: The team that controls turnovers and creates efficient shots can gain a major advantage.
Defensive Impact
Defense was one of the clearest statistical differences between the teams.
Indiana posted a 118.8 defensive rating, compared with Washington’s 122.7. The Pacers also allowed 120.4 points per game, compared with 124.9 for the Wizards.
Sarr was an individual bright spot for Washington, averaging 2.0 blocks per game. Bilal Coulibaly also contributed defensively with 1.3 steals and 1.0 block per game in his 56 appearances.
For a matchup between two teams with losing records, defensive consistency can make an especially large difference.
Players to Watch in a Pacers vs Wizards Matchup
Pascal Siakam
Siakam is the most obvious Indiana player to monitor because of his scoring, rebounding and all-around offensive role. His 24.0-point average made him the Pacers’ leading scorer among the listed regular-season performers.
Andrew Nembhard
Nembhard’s 7.7 assists per game make him a key player when evaluating Indiana’s offensive organization. If he creates efficient opportunities for teammates, the Pacers can become much harder to defend.
Alex Sarr
Sarr is central to Washington’s long-term development and was productive across several statistical categories. His 16.3 points, 7.4 rebounds and 2.0 blocks per game show why his development is important to the Wizards.
CJ McCollum
McCollum brought scoring and perimeter shooting to Washington. His 21.9 points per game and 39.3% three-point shooting made him one of the team’s most productive offensive options in his Washington sample.
How to Read Pacers vs Wizards Player Stats
When comparing individual statistics, Pacers vs Wizards avoid judging players solely by points per game.
A better evaluation considers:
- Scoring: How efficiently does a player create points?
- Rebounding: Does the player generate or prevent second chances?
- Assists: How much does the player contribute to team creation?
- Shooting: Can the player consistently convert from the field and three-point range?
- Defense: Are steals, blocks and defensive possessions translating into stops?
- Availability: How many games did the player actually play?
- Role: Is the player a primary option, starter, secondary creator or role player?
This approach gives a more balanced picture of the matchup than looking at one statistic.
Why Season Averages Do Not Tell the Whole Story
The Pacers and Wizards demonstrated this clearly in 2025-26.
Indiana finished with a better record and better defensive metrics, yet Washington won three of four head-to-head meetings.
Individual matchups, shooting variance, turnovers, injuries, rotations and home-court conditions can all influence a single NBA game.
For that reason, season averages are best used as a starting point rather than a prediction by themselves.
Frequently Asked Questions
Who won the Pacers vs Wizards series in 2025-26?
The Washington Wizards won the 2025-26 regular-season series 3-1. Indiana won the first meeting, while Washington won the following three.
Who led the Pacers in scoring in 2025-26?
Pascal Siakam led the Pacers’ listed regular-season performers at 24.0 points per game.
Who led the Wizards in scoring in 2025-26?
CJ McCollum averaged 21.9 points per game in his 35-game Washington sample, the highest scoring average among the Wizards’ listed players.
How many times did the Pacers play the Wizards in 2025-26?
The teams met four times during the 2025-26 regular season.
Which Pacers player had the most assists?
Andrew Nembhard averaged 7.7 assists per game for Indiana in 2025-26.
How did Alex Sarr perform for the Wizards?
Sarr averaged 16.3 points, 7.4 rebounds, 2.7 assists and 2.0 blocks per game across 48 games.
Which team had the better 2025-26 record?
Indiana finished 19-63, giving the Pacers two more wins than Washington’s 17-65 record.
Why are Pacers vs Wizards player stats useful?
Player statistics help explain how each team produces points, controls possessions, rebounds, creates shots and defends. They also provide useful context beyond the final score.
Conclusion
The Pacers vs Wizards matchup is a useful example of why team records and individual statistics should be analyzed together. Indiana finished the 2025-26 season with a slightly better record and stronger defensive numbers, while Washington won the head-to-head series 3-1.
Siakam’s scoring and rebounding, Nembhard’s playmaking, Sarr’s two-way potential and McCollum’s perimeter production give both teams several statistical storylines to follow.
For readers comparing these teams, the most useful approach is to look beyond points per game. Shooting efficiency, assists, rebounding, defense, availability and role all provide important context. Together, those numbers offer a much clearer picture of what separates the Pacers and Wizards and what could decide their next matchup.